FIVE-YEAR FINANCIAL SUMMARY
| 2018 | 2019 | 2020 | 2021 | 2022 | |
|---|---|---|---|---|---|
| For the Year | HK$bn | HK$bn | HK$bn | HK$bn | HK$bn |
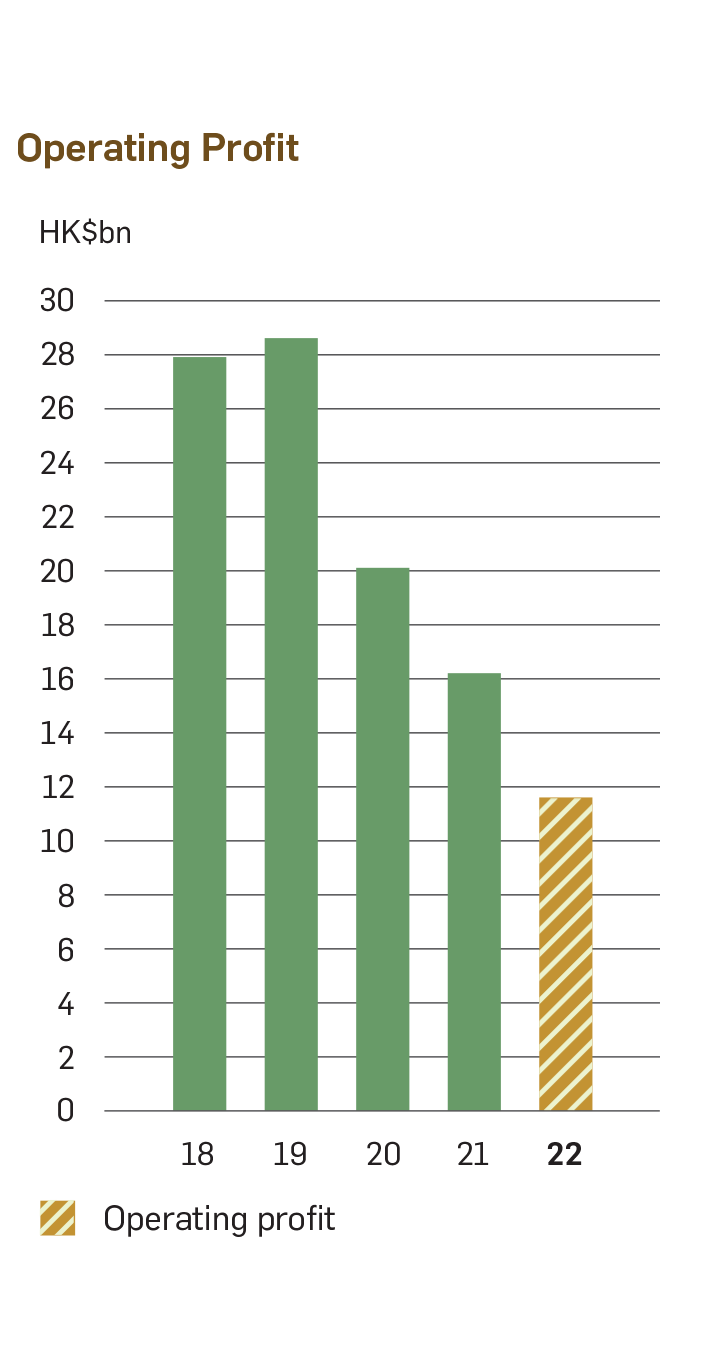
| Operating profit | 27.9 | 28.6 | 20.1 | 16.2 | 11.6 |
| Profit before tax | 28.4 | 28.8 | 19.4 | 16.4 | 11.4 |
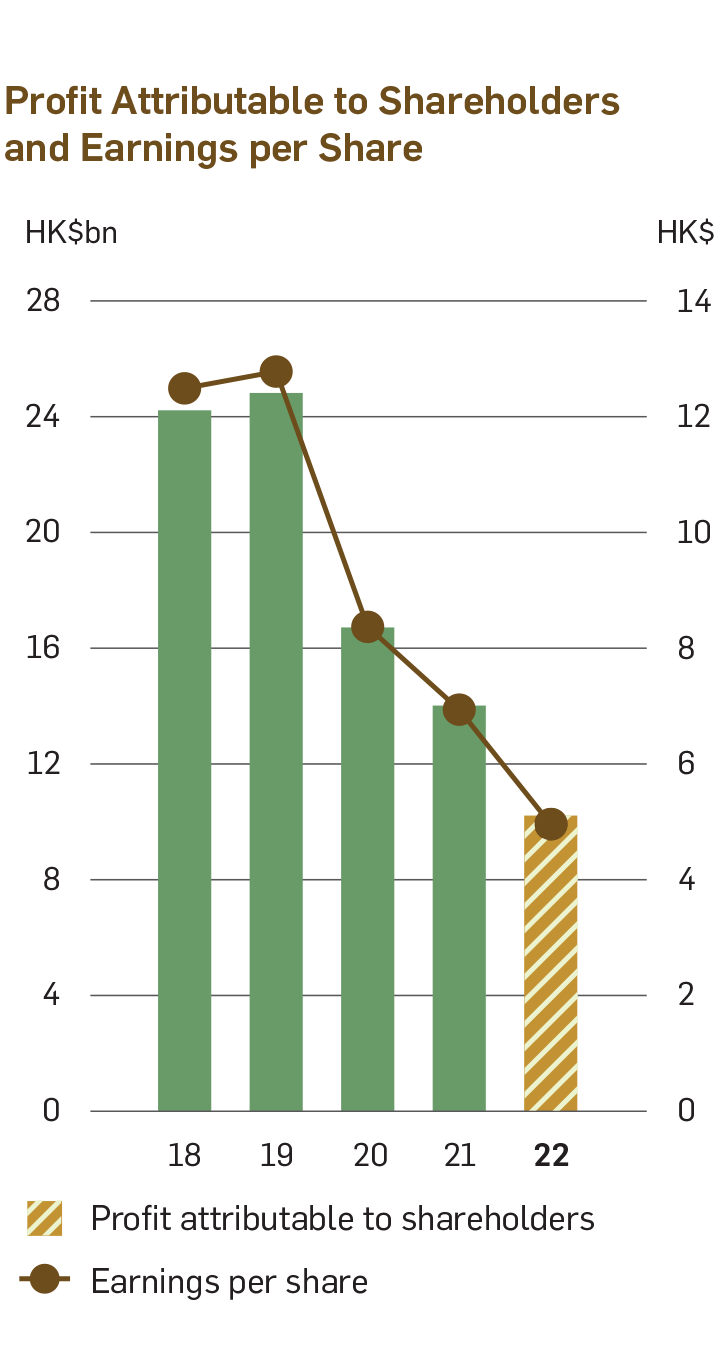
| Profit attributable to shareholders | 24.2 | 24.8 | 16.7 | 14.0 | 10.2 |
| At Year-end | HK$bn | HK$bn | HK$bn | HK$bn | HK$bn |
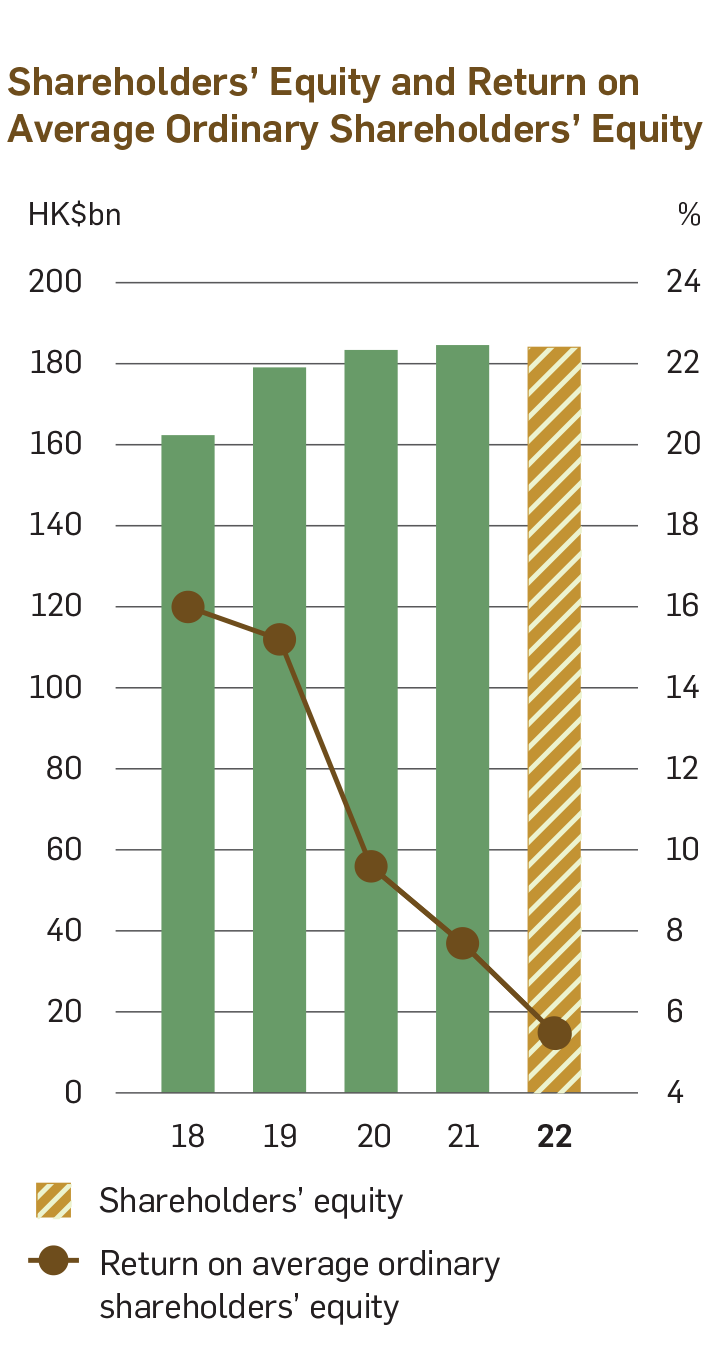
| Shareholders’ equity | 162.1 | 178.8 | 183.1 | 184.3 | 183.9 |
| Issued and paid-up capital | 9.7 | 9.7 | 9.7 | 9.7 | 9.7 |
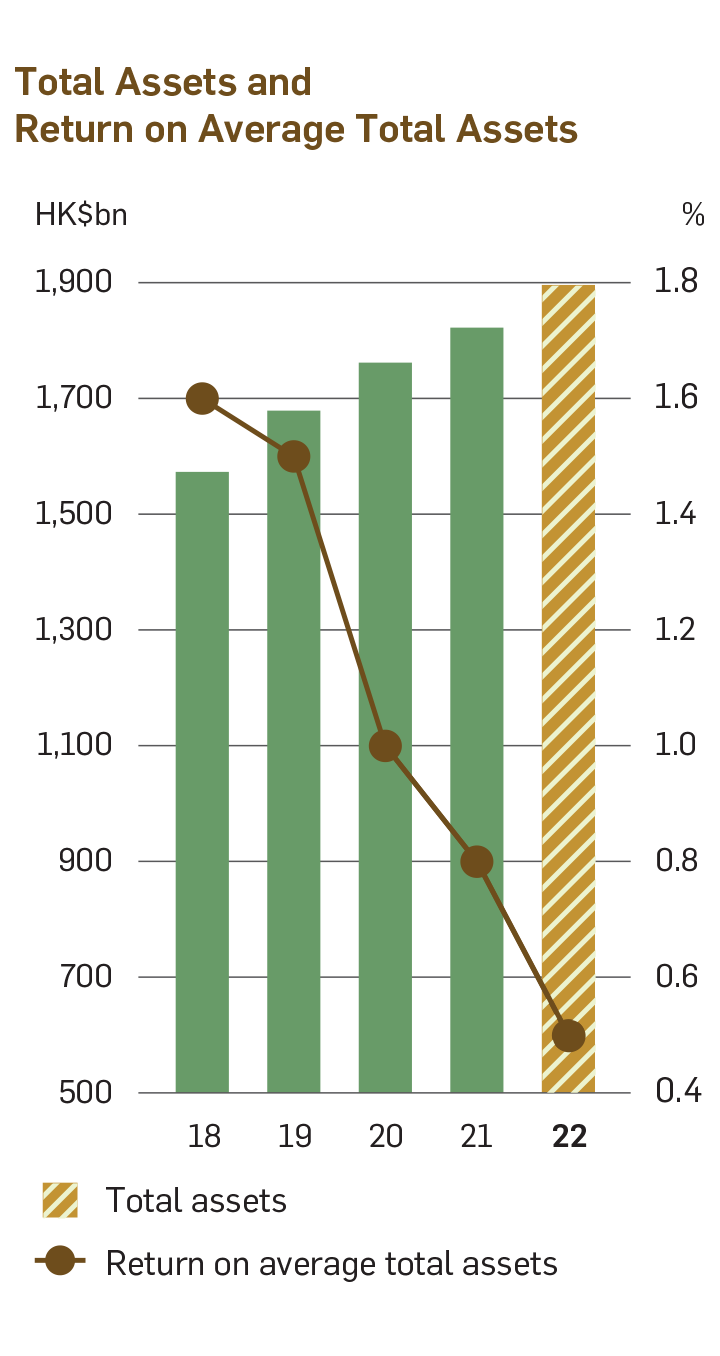
| Total assets | 1,571.3 | 1,677.0 | 1,759.8 | 1,820.2 | 1893.8 |
| Total liabilities | 1,409.2 | 1,498.1 | 1,576.6 | 1,635.8 | 1709.8 |
| Per Share | HK$ | HK$ | HK$ | HK$ | HK$ |
| Earnings per share | 12.48 | 12.77 | 8.36 | 6.93 | 4.95 |
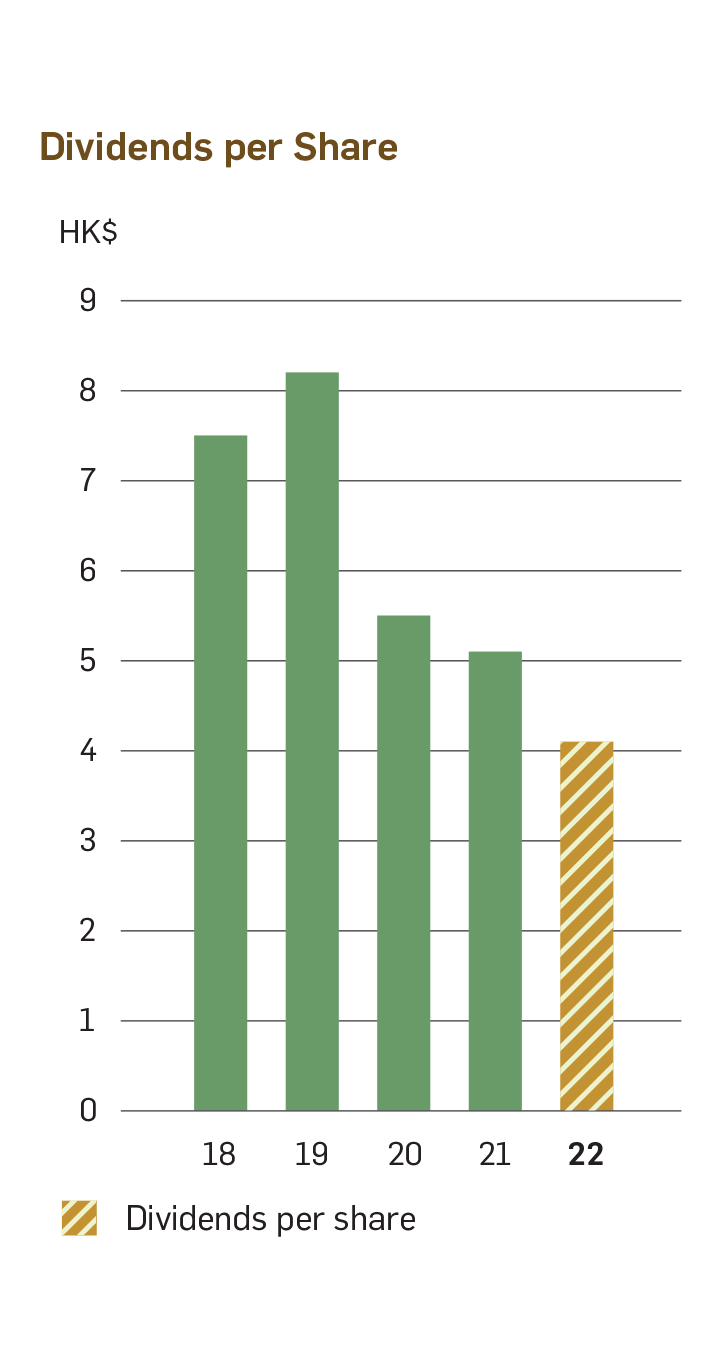
| Dividends per share - 1st to 4th interim dividends |
7.50 | 8.20 | 5.50 | 5.10 | 4.10 |
| Ratios | % | % | % | % | % |
| Return on average ordinary shareholders’ equity | 16.0 | 15.2 | 9.6 | 7.7 | 5.5 |
| Post-tax return on average total assets | 1.6 | 1.5 | 1.0 | 0.8 | 0.5 |
| Capital ratios | |||||
| - Common Equity Tier 1 ('CET1') Capital Ratio | 16.6 | 16.9 | 16.8 | 15.9 | 15.2 |
| - Tier 1 Capital Ratio | 17.8 | 18.7 | 18.5 | 17.5 | 16.8 |
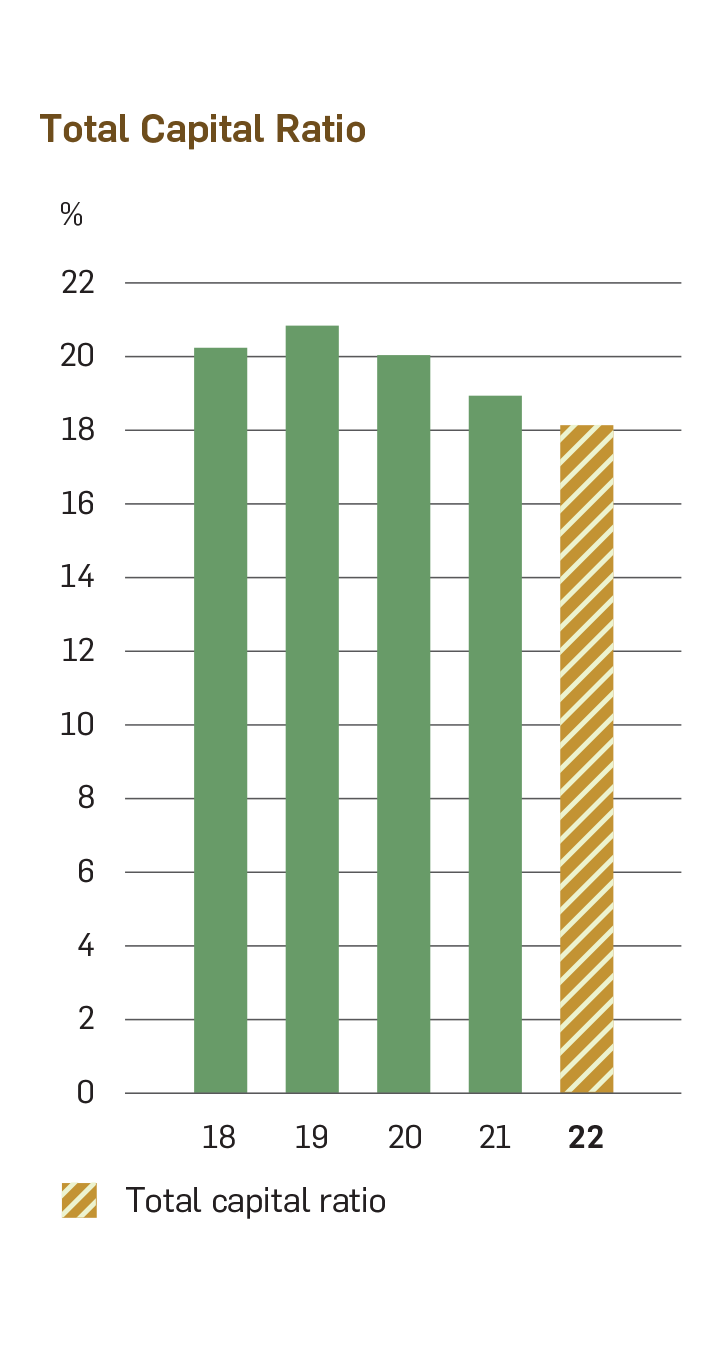
| - Total Capital Ratio | 20.2 | 20.8 | 20.0 | 18.9 | 18.1 |
| Cost efficiency ratio | 29.5 | 30.0 | 36.6 | 42.6 | 43.5 |