Five-year
Financial Summary
| 2020 | 2021 | 2022 (restated) |
2023 | 2024 | |
|---|---|---|---|---|---|
| For the Year | HK$bn | HK$bn | HK$bn | HK$bn | HK$bn |
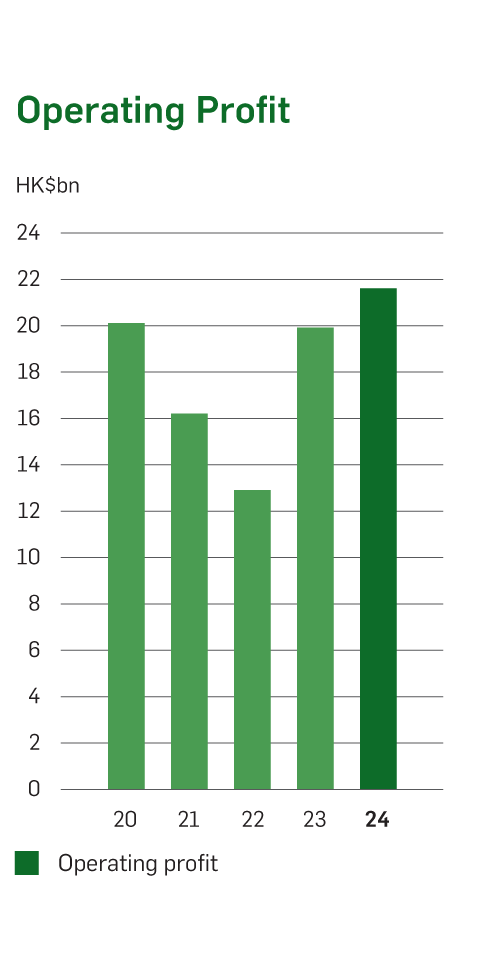
| Operating profit | 20.1 | 16.2 | 12.9 | 19.9 | 21.6 |
| Profit before tax | 19.4 | 16.4 | 12.8 | 20.1 | 21.0 |
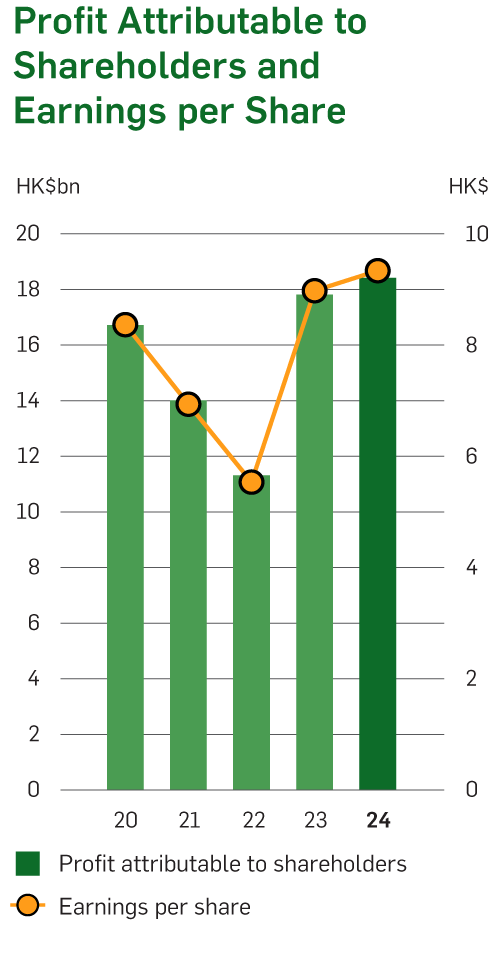
| Profit attributable to shareholders | 16.7 | 14.0 | 11.3 | 17.8 | 18.4 |
| At Year-end | HK$bn | HK$bn | HK$bn | HK$bn | HK$bn |
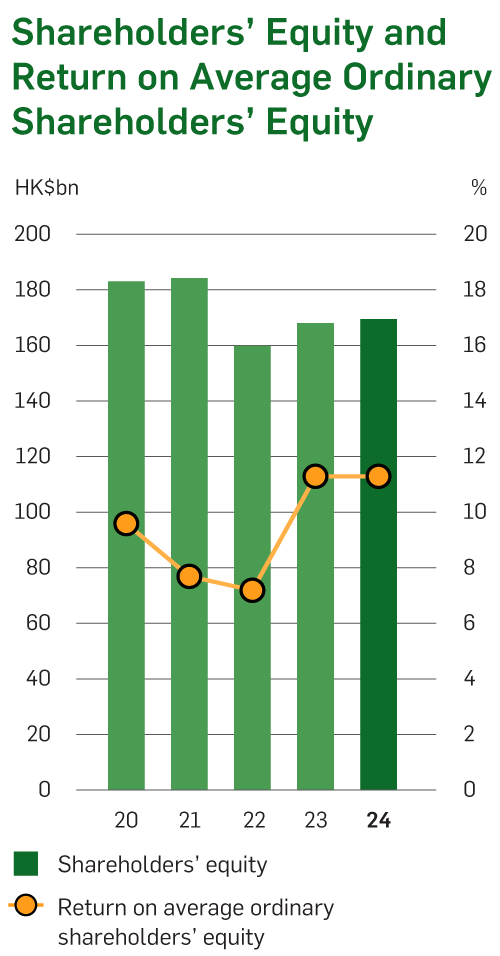
| Shareholders’ equity | 183.1 | 184.3 | 159.9 | 168.1 | 169.5 |
| Issued and paid-up capital | 9.7 | 9.7 | 9.7 | 9.7 | 9.7 |
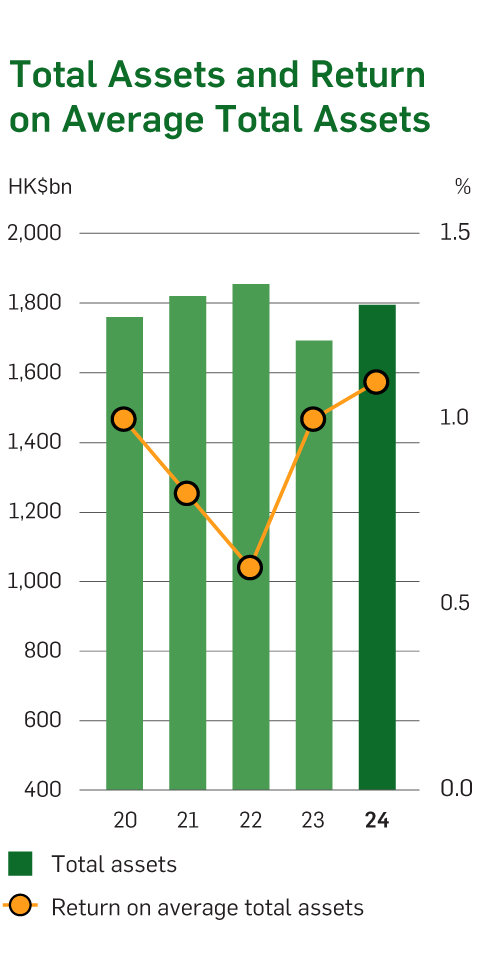
| Total assets | 1,759.8 | 1,820.2 | 1,854.4 | 1,692.1 | 1,795.2 |
| Total liabilities | 1,576.6 | 1,635.8 | 1,694.4 | 1,523.9 | 1,625.6 |
| Per Share | HK$ | HK$ | HK$ | HK$ | HK$ |
| Earnings per share | 8.36 | 6.93 | 5.53 | 8.97 | 9.33 |
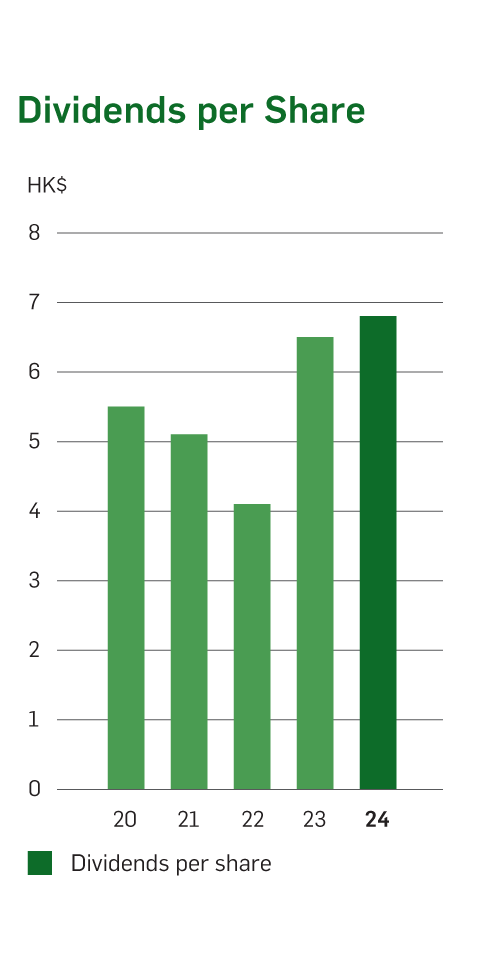
| Dividends per share | |||||
| - 1st to 4th interim dividends | 5.50 | 5.10 | 4.10 | 6.50 | 6.80 |
| Ratios | % | % | % | % | % |
| Return on average ordinary shareholders’ equity | 9.6 | 7.7 | 7.2 | 11.3 | 11.3 |
| Post-tax return on average total assets | 1.0 | 0.8 | 0.6 | 1.0 | 1.1 |
| Capital ratios | |||||
| - Common Equity Tier 1 ('CET1') Capital Ratio | 16.8 | 15.9 | 15.2 | 18.1 | 17.7 |
| - Tier 1 Capital Ratio | 18.5 | 17.5 | 16.8 | 19.9 | 19.4 |
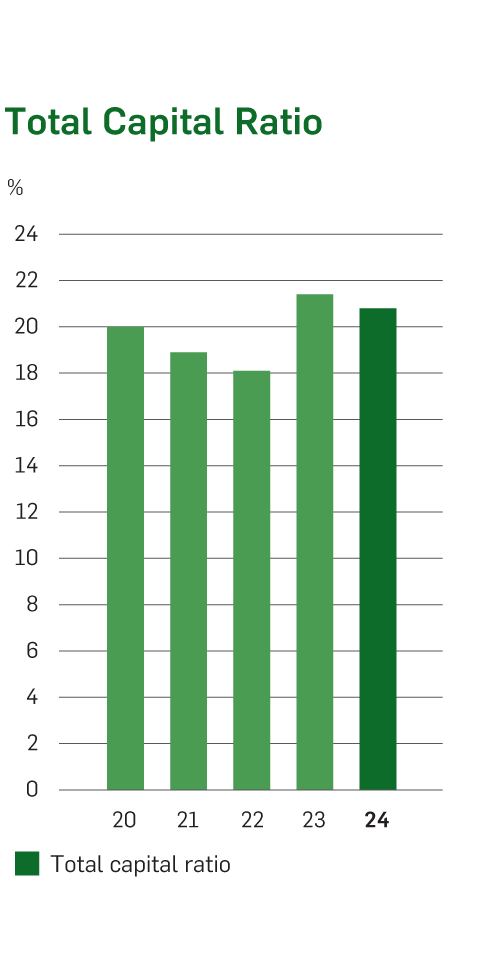
| - Total Capital Ratio | 20.0 | 18.9 | 18.1 | 21.4 | 20.8 |
| Cost efficiency ratio | 36.6 | 42.6 | 40.1 | 35.8 | 36.6 |
Unless otherwise stated, all tables in the 2024 Annual Report are presented on a reported basis. Financial results of 2024, 2023 and 2022 are prepared on HKFRS 17 basis and that of 2020 and 2021 are prepared on HKFRS 4 basis and are not comparable.